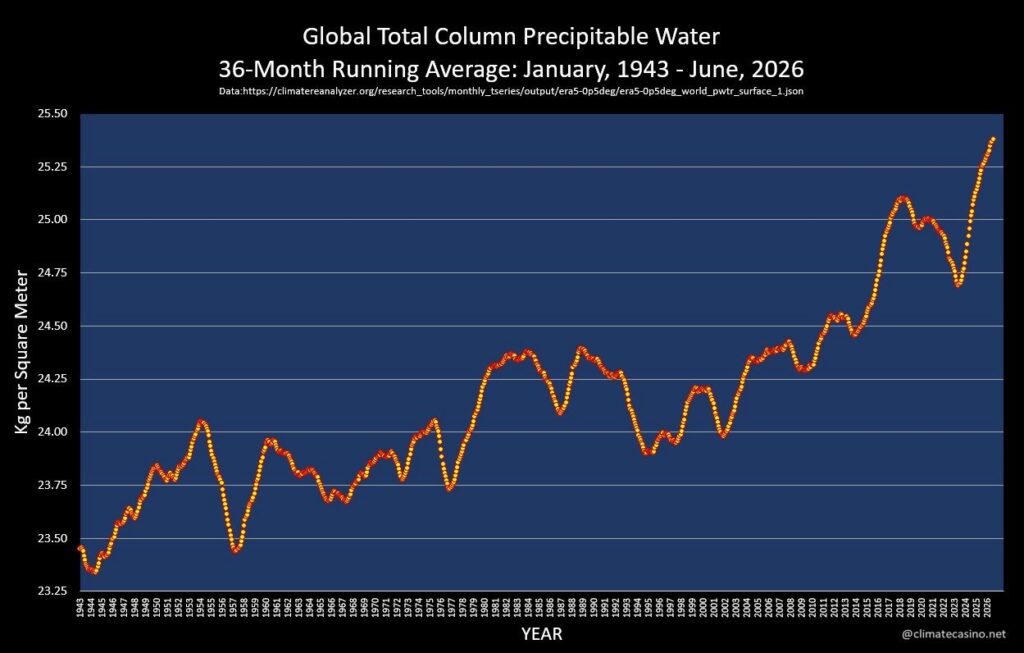
Prof Eliot Jacobson published this graphic a few days ago:
We can be extremely thankful for this data we as it helps us with risk mitigation.
Have you heard of the Clausius-Clapeyron relationship? This is one of the most robust findings in atmospheric physics (you can read more about it here) basically the finding is this:
the atmosphere’s water-holding capacity increases by roughly 7% per °C of warming.
The graphic shows the latest Global Total Column Precipitable Water 36-Month Running Average
Here is a way to understand total column precipitable water:
Think of the atmosphere as a giant sponge. Total column precipitable water measures how much water that sponge is holding from the ground right up to the edge of space. The wetter the sponge, the more water is available to produce heavy rain if the right weather conditions develop.
What does the current 36-month running mean?
The graph shows that Earth’s atmosphere is holding more moisture than at any point in the observational record. A warmer atmosphere can store more water vapour, providing more fuel for heavy rainfall when storms develop, while also increasing evaporation that can intensify drought where rain fails to occur.
In other words, the atmosphere is becoming more energetic, increasing the potential for more intense hydrological extremes.
When weather systems now produce conditions which make rainfall possible, we have to understand that risk for extreme precipitation has now increased dramatically and we have to plan accordingly.
This is why you in the latest IPCC assessment they make this observation as we continue to heat:
risks are highest where species and people exist close to their upper thermal limits, along coastlines, in close association with ice or seasonal rivers (high confidence).
I’m n recent times we have seen how seasonal rivers can become ragging torrents because more water falls during rainfall events. Here are some examples of this from last year: