For the first time in this crisis, we now have a clearer, system-wide view of Knysna’s water position.
The newly released Department of Water & Sanitation Knysna Water Dashboard provides consolidated visibility into demand, pumping performance, storage levels, and rainfall.

This matters a lot!
Until now, we were working with partial daily updates and piecing the system together from individual components. We can now see the entire broader structure.
So what does it show?
Storage has recovered - for now
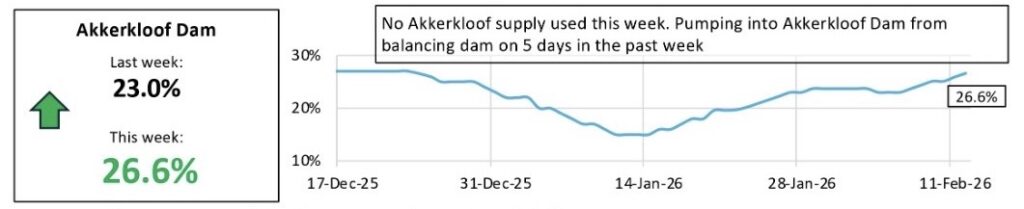
Akkerkloof has risen from 23% to 26.6% over the past week.
That is a meaningful improvement!
The increase aligns with the 103 mm of rainfall recorded across the region in the past week and the resumption of pumping from Charlesford. Importantly, no water was drawn directly from Akkerkloof this week. The strategy to treat the dam as a reserve while other sources carried the load has continued.
That is good system management.
Demand Is Rising Again
Knysna water demand increased from a weekly average of 11,909 kL/day to 12,969 kL/day. This is an increase of more than 1,000 kL/day in just one week.

This is the most concerning signal on the dashboard.
The 103 mm gave some breathing room, but the rising demand can quickly remove it!
If demand continues trending upward while rainfall normalises, the storage gains we’ve just seen can reverse quickly.
Raw Water Input Shows a Structural Decline
The most important signal in the latest data is not the dam percentage, it is the trend in combined raw water input across all systems.
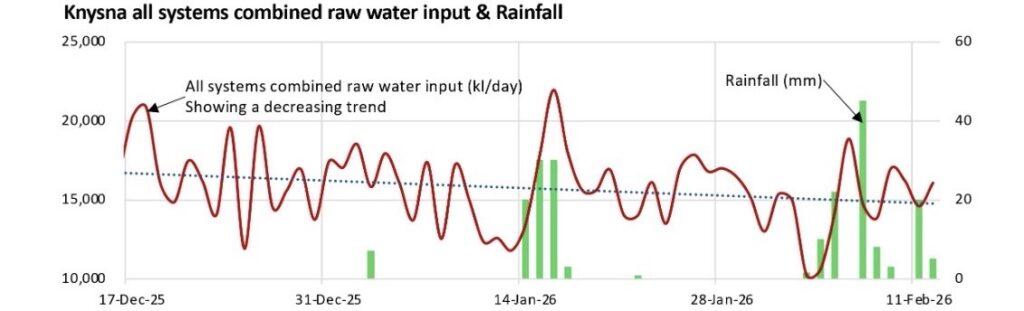
The DWS data reflects total raw water entering the treatment works from river abstraction, dams, springs, and groundwater combined and not just Charlesford.
After the recent rainfall event, total raw water input rose sharply. That pulse allowed storage to recover and reduced immediate pressure on Akkerkloof.
However, the latest readings show that total system input has already started to trend downward again.
This matters because:
- When combined raw input sits above daily demand, storage can stabilise or grow.
- When combined raw input falls below demand, the system must lean on stored water.
- When this happens repeatedly, dam levels begin to decline, even if the drop is not immediately visible.
In simple terms:
The rain gave the system a temporary lift.
But the structural balance between total incoming water and total outgoing demand still determines whether the system stabilises or slides back toward drawdown.
The downward shift in total raw input suggests the system is moving out of the “pulse” phase and back toward its underlying supply-demand tension.
That is the real early-warning signal.
Pump Operations Are Critical
Charlesford is averaging 172 l/s (22 hrs/day).
Glebe is producing ~2,468 kL/day.
Gouna was operational for only 4 days this week.

The system is highly dependent on pump reliability right now. Any outage, mechanical or electrical, would immediately tighten the margin again.
That is the hard truth.
What all this means
We no longer have blind spots. The situation has improved from the immediate danger of early February. But it has not resolved.
We are in what one could call “a managed recovery window,” but this is not a return to security.
The system is holding because:
- Rain arrived,
- Pumps are running,
- Storage is being protected.
It will only remain stable if:
- Demand does not climb,
- Pump reliability continues,
- Additional rainfall events follow.
This transparency into the system is powerful. For the first time, we can see the everything as a whole. That gives us the ability to respond intelligently and understand that the need for caution is still very necessary.
We are most definitely not out of the woods.