The Department of Water and Sanitation (DWS) has released its latest weekly dashboard for the Knysna water system, providing a snapshot of consumption, production, and storage levels as of early March.

At first glance the situation appears more stable than it did several weeks ago. Akkerkloof Dam is currently sitting at just over 31%, significantly higher than the critically low levels recorded earlier in the summer. (Note: There is an error in the DWS dashboard. They indicate that Akkerkloof is at 32.4%. This should read 31.4%)
However, stabilisation does not mean the system has recovered. Current conditions reflect a carefully balanced operational system, where production, storage and consumption are being actively managed to maintain supply.
In other words, the immediate emergency phase appears to have passed, but the underlying water system remains sensitive to changes in river flow, infrastructure performance and consumption patterns.
A system moving out of emergency mode
In January the Knysna water system entered what can fairly be described as an emergency phase.
Akkerkloof Dam dropped to around 15%, and the municipality struggled to maintain stable production from several key pump stations. At the same time, river flows weakened and infrastructure failures limited the system’s ability to move available water.
During this period Gift of the Givers stepped in to assist by transporting water into town using tanker trucks. These trucks operated daily for several weeks, helping to stabilise supply while infrastructure repairs and rainfall improved conditions.
According to Gift of the Givers, tanker operations stopped on 28 February, when Akkerkloof Dam had recovered to roughly 32%.
That moment likely marks a transition point in the system: from emergency support toward normal operational management.
What the official dashboard shows
The latest DWS dashboard highlights several important trends.
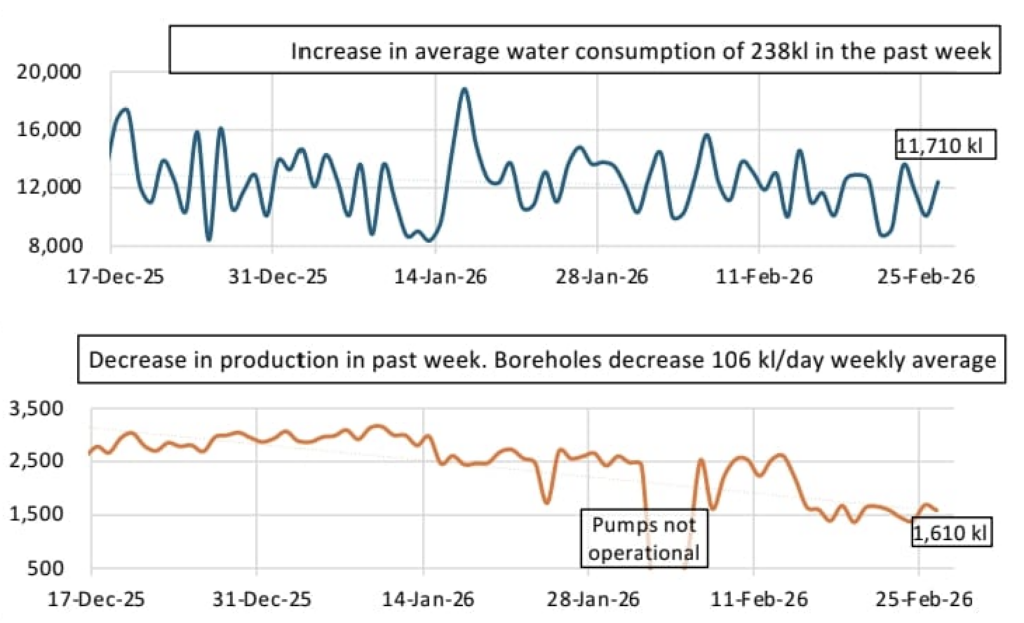
Average water consumption in the Knysna system increased slightly over the past week, rising from 11,417 kilolitres per day to about 11,655 kilolitres per day. While this increase is modest, it shows that overall demand remains relatively high despite Level 4 water restrictions.
The current 7-day Knysna consumption average is ~11 ML/ day
At the same time, the dashboard indicates that production from some sources has been declining slightly. Borehole production, for example, dropped by around 106 kilolitres per day in the past week’s average.
Pump station performance has also been uneven. Charlesford and Glebe pump stations both recorded lower average outputs compared with previous weeks, highlighting how sensitive the system remains to infrastructure reliability.
But perhaps the most important signal in the dashboard appears in the combined supply chart.

The total raw water input to the system is currently showing a declining trend. In other words, the overall volume of water entering the system from rivers, boreholes and other sources is decreasing over time.
When raw water input declines while demand remains stable, the system becomes increasingly dependent on storage and careful operational management.
These fluctuations matter because the Knysna system operates with very little spare capacity.
The role of Akkerkloof Dam
Akkerkloof Dam continues to play a critical role in balancing the system.
The dashboard notes that water from Akkerkloof was used on five days during the past week, with an average supply of about 4,551 kilolitres per day. This is a significant increase compared with the previous week.
In practice this means the dam is acting as a buffer for the system. When production temporarily falls short of consumption, water can be released from storage to stabilise supply.
This is exactly how the system is designed to operate, but it also means that storage levels remain an important indicator of system health.
At roughly 31.4%, Akkerkloof is currently stable but still relatively low in the context of its total capacity.
River flow remains a key factor
Another important piece of the puzzle is the condition of the Knysna River system.
Recent river gauge readings suggest that flows have weakened again following earlier rainfall events in February. While parts of the Garden Route experienced above-average rainfall last month, river systems often respond unevenly depending on catchment conditions.
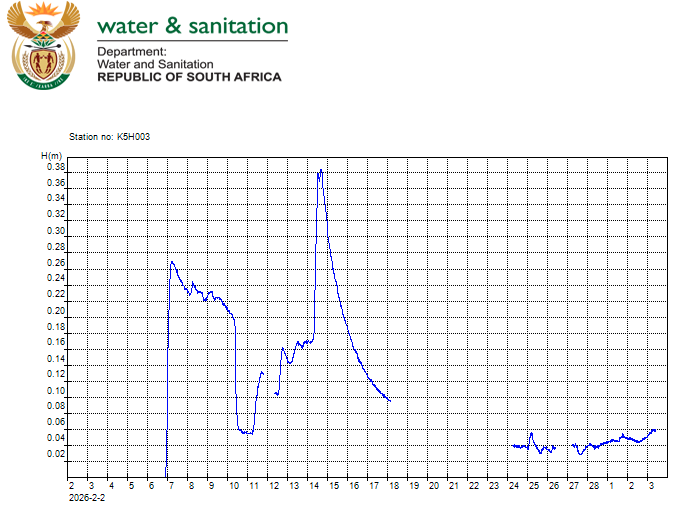
This is not unusual. Rainfall totals do not always translate into sustained river flow, particularly when catchment soils and groundwater systems are still recovering from dry conditions. When river flows weaken, the municipality must rely more heavily on pump stations, boreholes and storage to maintain supply.
This increases the system’s sensitivity to infrastructure failures or sudden changes in demand.
Monitoring the system between official updates
Municipal and national dashboards provide valuable snapshots of the Knysna water system, but these updates typically appear weekly or at irregular intervals.
Because conditions in the system can change quickly particularly when river flows fluctuate or infrastructure performance varies it is useful to monitor a few key indicators between official reports.
Three indicators are particularly helpful:
- river stage levels at the Charlesford abstraction point and at Millwood
- short-term system balance between production and consumption
- storage levels at Akkerkloof Dam
When considered together, these indicators help reveal whether the system is moving toward greater stability or beginning to experience renewed pressure.
One way to track these changes is through the Early Warning Signal dashboard, which combines these indicators into a simple "direction" signal.
🟩 Stabilising
🟨 Stable but Fragile
🟥 Pressure Increasing
The current signal indicates “Pressure Increasing.”

This does not mean the system is facing an immediate shortage. Instead, it reflects a subtle shift in underlying conditions: river flows have weakened again while overall raw water input to the system has begun to decline.
Signals like this are useful because they often highlight changes in system behaviour before those changes become visible in dam levels alone.
Stable for now, but fragile
Taken together, the data suggests that Knysna’s water system has moved out of the most acute phase of the crisis, but it remains fragile.
Emergency tanker support has ended, infrastructure repairs are underway, and the system is currently able to balance production and demand. However, that balance still depends on several factors working together: reliable pump infrastructure, stable river flows and responsible water use.
Importantly, stabilisation does not mean water is abundant.
The margin for error remains relatively small, and sustained increases in consumption or infrastructure failures will quickly place additional pressure on the system.
What to watch in the weeks ahead
Several factors will determine how stable the system remains during the coming months.
River flows in the upper catchments will continue to play an important role in supporting abstraction. Infrastructure reliability will also remain critical, as pump failures can quickly affect production levels.
Storage trends at Akkerkloof Dam will provide another important indicator of system pressure.
If production consistently exceeds demand, storage levels should gradually increase. If not, the dam will continue to act as a balancing buffer.
For now, the data suggests the system is operating in a carefully managed equilibrium.
Maintaining that balance will depend not only on infrastructure and rainfall, but also on continued responsible water use across Knysna.