We have all seen Waterfront Drive look like this during some high tides.
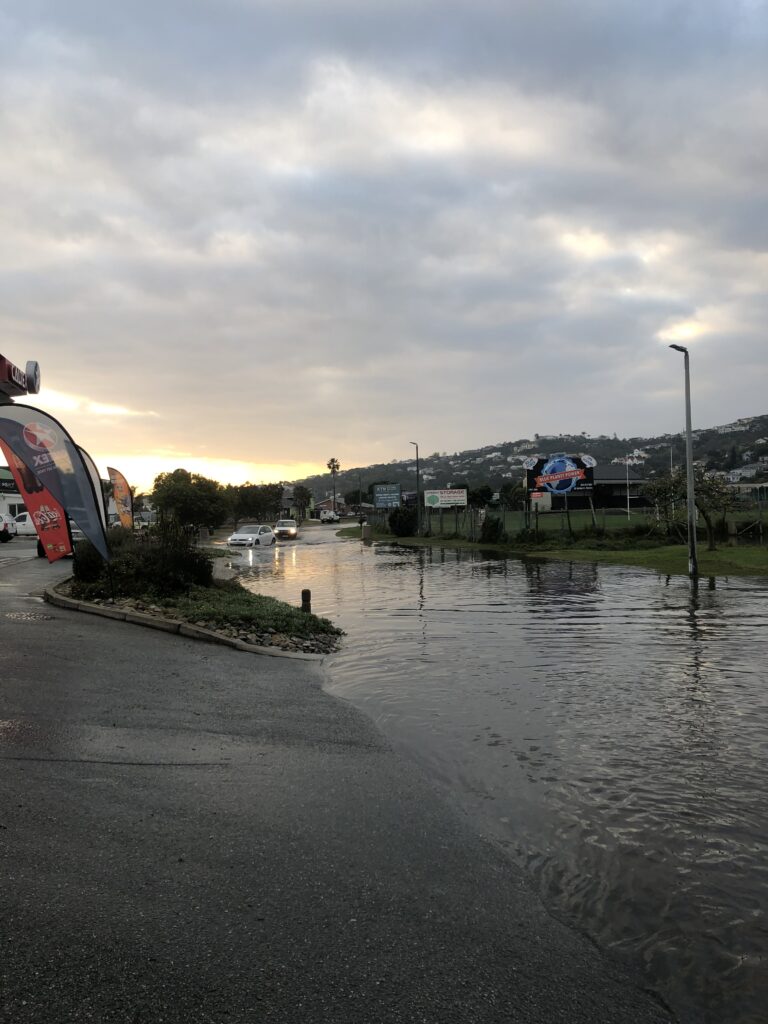
These events often happen when the high tide approaches about 2 metres, especially if a small storm surge is present. It’s easy to dismiss them as an inconvenience caused by an unusually high tide. But in reality, these events are the first visible sign of long-term sea-level rise starting to interact with the local landscape.
Understanding why this happens and why it will likely happen more often in the future is important for everyone living along the estuary.
What “Sunny-Day Flooding” Means
Flooding without rain is known globally as “tidal flooding” or “sunny-day flooding.” It happens when high tide alone is enough to push water onto land.
In Knysna’s case, the estuary water level is strongly controlled by tides entering through the narrow inlet at the Knysna Heads. When the ocean tide rises, the estuary rises with it.
Many parts of the estuary shoreline including marinas, low roads, (eg. Waterfront Drive, George Rex Drive) and marsh edges sit only slightly above the high-tide level. When the tide approaches about 2 metres, water begins to overtop low edges or flow back through the drainage system.
If a small storm surge coincides with that tide, water levels can briefly rise even higher. There is an event like this forecast for the morning high tide on Saturday March 7th. A high tide of 1.87 m plus a storm surge forecast of 0.3 m resulting in a total high tide of 2.17 m.

These events are not unusual in coastal towns worldwide, but what matters is how often they happen.
Why these floods are becoming more common
Global sea level has been rising steadily for decades. Satellite measurements since 1993 show an average rise of about 3–4 millimetres per year globally, with evidence that the rate is accelerating. In some parts of the South African coast the observed rate is even higher.
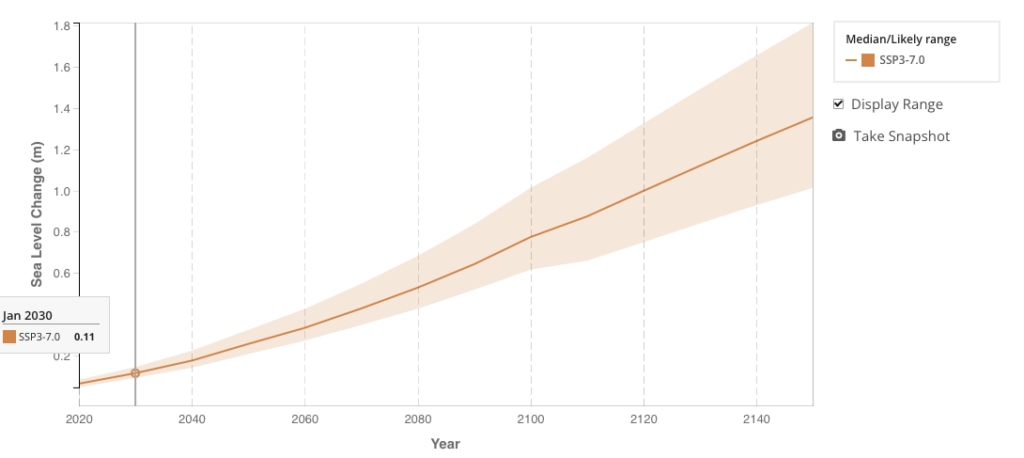
Under a mid-range emissions scenario (SSP3-7.0), sea level along the south coast is projected to rise about 10–12 cm by 2030, with substantially larger increases later in the century.
Even small increases shift the threshold at which high tides begin to cause flooding. A rise of just 10 cm means that every tide is effectively 10 cm higher than it used to be. Tides that once stopped just below the flooding threshold now cross it.
This is why sunny-day flooding tends to increase gradually before permanent inundation becomes an issue.
In many coastal towns around the world from Florida to Australia the first noticeable sign of sea-level rise has been exactly this: more frequent nuisance flooding during high tides.
Why the South African south coast may feel it sooner
Along the southern Cape coast, sea-level changes are influenced not only by global warming but also by regional ocean dynamics.
The powerful Agulhas Current flows southward along the east and south coast of South Africa. Ocean currents like this affect the height of the sea surface along the coast. When the current strengthens or shifts, it can slightly raise the coastal sea level.
Satellite observations show that sea levels along parts of the South African coastline have been rising slightly faster than the global average in recent decades. A recent analysis of satellite altimetry data found coastal trends ranging from –4 to 8 mm per year, with positive trends across much of the coast and particularly along the Agulhas Bank. In some locations such as Cape Town, observed rates of about 6 mm per year are nearly double the global average.
Even a few extra centimetres over time can make a noticeable difference when tides already approach the flooding threshold.
Why Knysna is particularly sensitive
Knysna’s geography makes it especially responsive to small changes in sea level.
Three factors play a role:
- A narrow inlet: The estuary connects to the ocean through a relatively narrow gap at the Heads. This means ocean water entering on a rising tide can temporarily accumulate in the estuary.
- A large shallow estuary: Because the estuary is broad and shallow, small increases in water level can spread across large areas of shoreline.
- Low-lying infrastructure: Much of the development along the estuary edge sits close to the high-tide level. Even a few centimetres of additional water can affect roads, drainage systems, and waterfront properties.
Together, these factors mean that small increases in sea level can translate into noticeable flooding events sooner than many people expect.
Here is what this could look like for Knysna by 2030.
This map from Climate Central shows land expected to fall below the level of flooding that could occur at least once per year under a mid-range emissions scenario. Low-lying parts of the estuary shoreline including areas around Thesen Island, Leisure Isle and sections of the estuary margins are particularly exposed.

The red areas indicate land that could experience annual coastal flooding by around 2030 under current projections. This does not mean these areas will be permanently underwater, but it does mean that high tides combined with modest storm surges could flood them at least once a year. In a estuary system like Knysna’s, where water levels inside the estuary closely track ocean tides entering through the Knysna Heads, even small increases in sea level can shift the threshold at which flooding begins.
What local observations are already showing
Local observations have noticed that flooding tends to occur when high tides approach around 2 metres. This kind of local observation is actually very valuable.
Scientists often identify flood thresholds by combining:
- observed flooding events
- tide levels
- local elevation data
Tracking when these thresholds are crossed over time provides one of the clearest indicators of how sea-level rise is affecting a community.
The key change to watch is not a single flood but how frequently these events occur each year.
What the future likely looks like
If sea level continues to rise at roughly the current rate, the pattern usually follows a predictable progression:
- Rare flooding during extreme tides
- Occasional sunny-day flooding during spring tides
- Regular nuisance flooding several times per year
- Frequent flooding during many high tides
Many coastal communities worldwide are already moving through this sequence.
For Knysna, the sunny-day flooding people are beginning to notice may represent the early stages of this process. None of this means Knysna is about to disappear under the sea. Sea-level rise is gradual, unfolding over decades.
But it does mean that:
- flood events will likely become more frequent
- drainage systems will need adaptation
- infrastructure planning must account for changing water levels
The earlier communities understand these changes, the easier it becomes to plan sensible responses. If you have been following tide forecasts or the coastal surge outlook from the South African Weather Service you will have already noticed how small factors combine:
- high spring tides
- wind pushing water toward the coast
- slightly lower atmospheric pressure
When these occur together, water levels can briefly exceed the estuary's natural thresholds. Monitoring these patterns over time can help the community understand how conditions are changing.
An early warning
Sunny-day flooding is not dramatic. It arrives quietly: a road briefly underwater, a storm drain bubbling, a jetty sitting lower than usual.
But in many places around the world, these small events have turned out to be the first clear signal of rising seas interacting with coastal towns.
In Knysna, those occasional high-tide floods are telling us something important: The ocean is beginning to knock on the door.
Transparency note: AI tools sometimes assist with structuring, drafting, and editing these updates. All analysis, interpretation, and final editorial judgement remain my own.